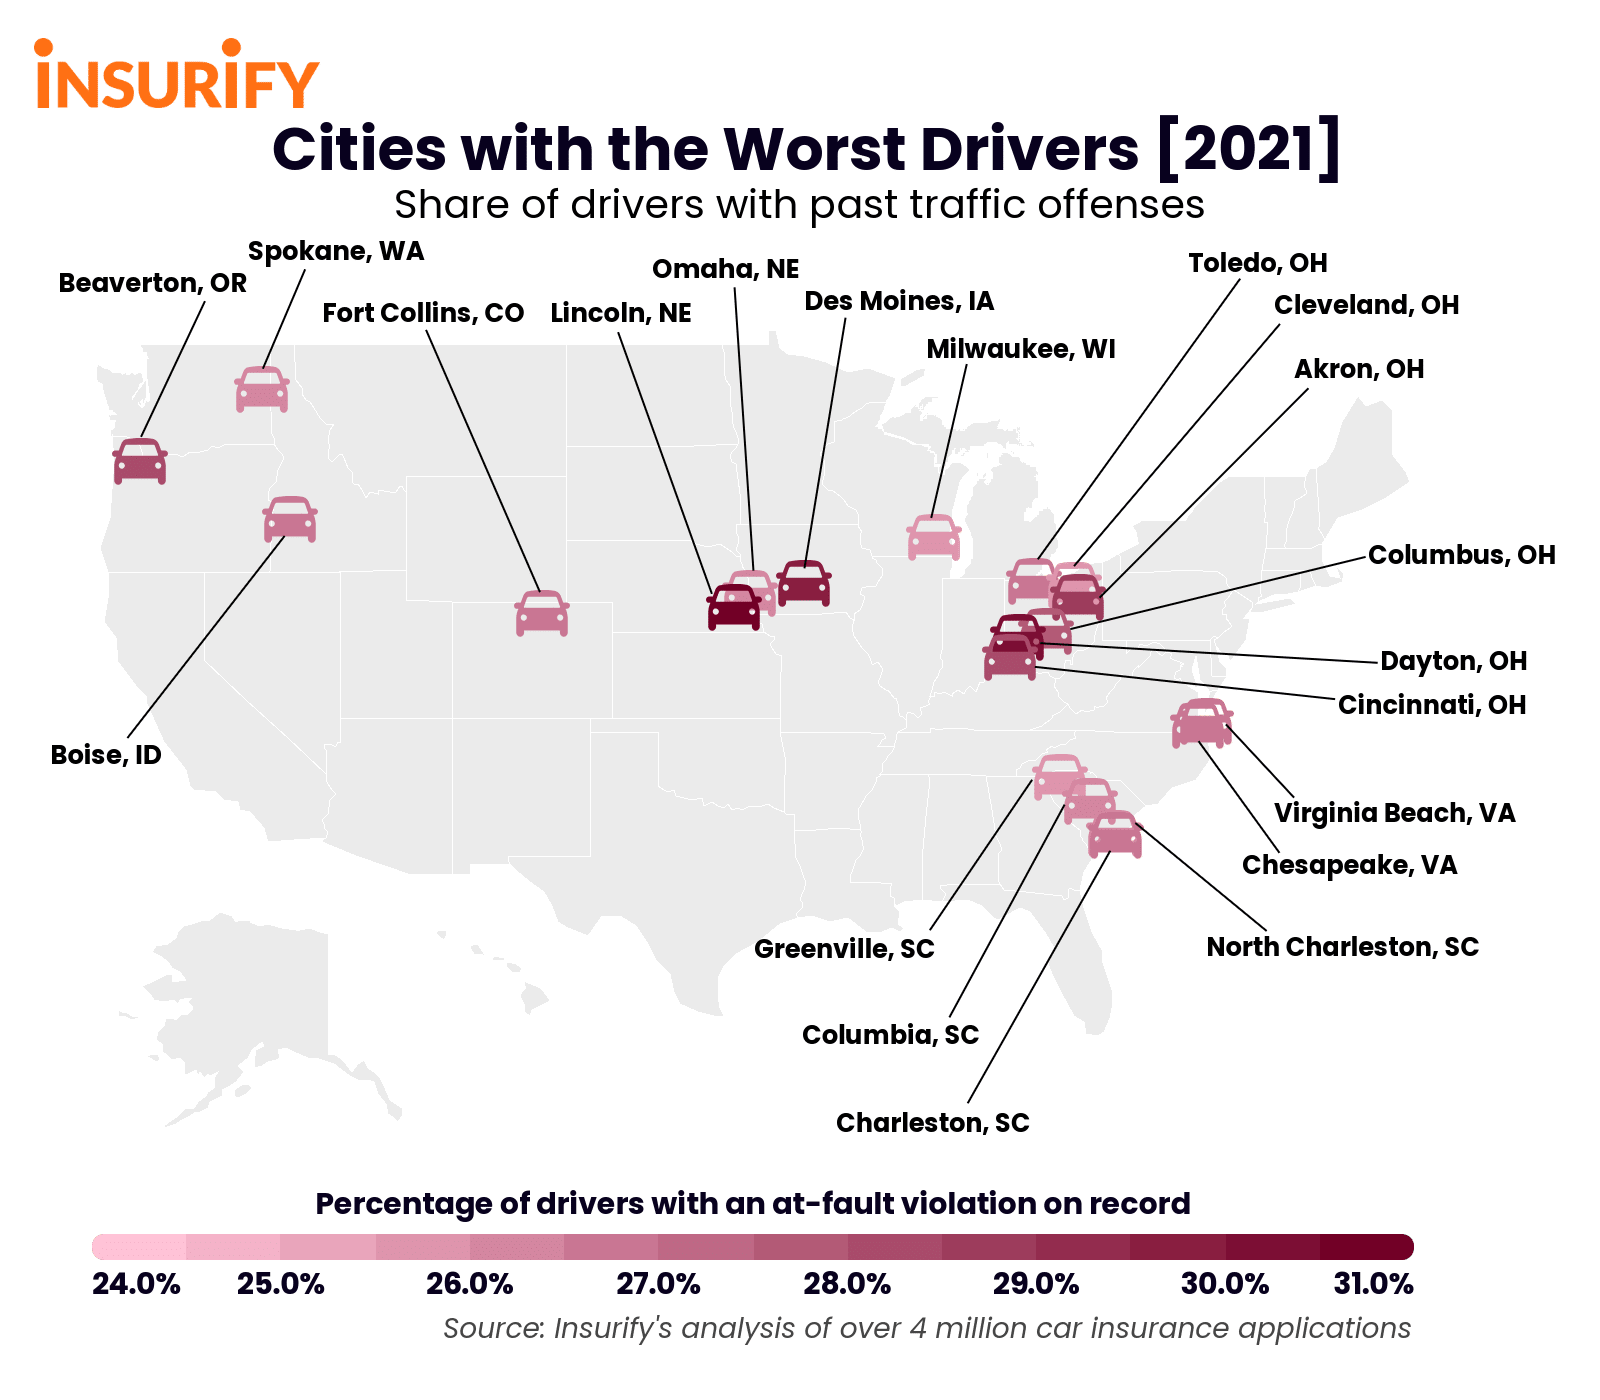
Cities with the Worst Drivers
Drivers in these twenty U.S. cities have racked up the most moving violations in the nation, earning them the title of America’s worst drivers in 2021.
As cities reopen this year, many of us are eager to get “back to normal” after a year of uncertainty and isolation. A semblance of life outside of lockdown is taking shape as restaurants, bars, concerts, and other large in-person gatherings reopen in full force, to many city dwellers’ relief.
At least one aspect of pre-pandemic life that most have not missed is also on the comeback: traffic. According to the Institute for Transportation and Development Policy, car traffic is on the rise this year. In certain cases, traffic levels have even begun exceeding pre-pandemic levels as of March 2021.
While it’s exciting that there are places to go again, driving to get to them is not always painless. In fact, sharing the road with drivers who flout the rules of civil traffic conduct can be downright stressful. In some cities, these ill-behaved drivers are, unfortunately, more common than in others. To see which cities are home to the worst drivers in 2021, the research team at Insurify referred to their database of over 4 million car insurance applications.
Insights
- National averages. Across the 244 urban areas surveyed, 19.32 percent of drivers reported a prior incident on their driving record. The two most commonly cited driving violations are at-fault accidents and speeding, which drivers incur at an average of 10.39 percent and 9.66 percent, respectively.
- Ten states represented among the top twenty cities. A total of ten states encapsulates the twenty cities with the worst drivers in the nation in 2021. Of these ten, South Carolina, Virginia, Ohio, and Nebraska have regional clusters of two or more cities on the list. Overall, the ten states represented in the rankings are relatively geographically diverse, ranging from the Pacific Northwest to the Midwest, to the Southeast.
- High citation rates in the Buckeye State. Six out of the twenty cities with the nation’s worst drivers in 2021 are located in Ohio, making it the most highly represented state in the rankings. On the state level, Ohio drivers have the highest driving citation rate in the nation: 28.18 percent of Ohioans have at least one at-fault violation on record, according to Insurify’s analysis of states with the worst drivers in 2021.
Methodology
To identify the cities with the worst drivers, the data scientists at Insurify, a car insurance comparison site, referred to their database of over 4 million car insurance applications.
When applying for car insurance, users disclose their city and state of residence and any prior violations on their driving record. Insurify’s data scientists compared the number of drivers with one or more at-fault violations on record (including accidents, DUIs, failures to stop, speeding, reckless driving, passing violations, and other citations for illegal driving behavior) to the total number of drivers applying for car insurance in each state over the past year. The cities with the highest proportion of drivers with at-fault incidents on record earned a spot in the rankings of the cities with the worst drivers in America.
In this study, cities were defined based on the United States Census Bureau’s classification of an “urbanized area,” an urban area with a population over 50,000.

Cities with the Worst Drivers (2021)
In 2021, Lincoln, Nebraska has the worst drivers in the nation. Lincoln has the highest percentage of drivers with at least one at-fault violation on record, at 30.79%. Ohio is home to the most cities with bad drivers: Dayton, Akron, Cincinnati, Columbus, Toledo, and Cleveland also have some of the worst drivers.
Cities with the Worst Drivers, 2021
20. Greenville, SC
- Share of drivers reporting a prior incident: 25.53%
- Share of drivers at-fault accidents on record: 14.35%
- Share of drivers with speeding infractions on record: 14.74%
19. Cleveland, OH
- Share of drivers reporting a prior incident: 25.68%
- Share of drivers at-fault accidents on record: 11.09%
- Share of drivers with speeding infractions on record: 15.41%
18. Milwaukee, WI
- Share of drivers reporting a prior incident: 25.71%
- Share of drivers at-fault accidents on record: 9.66%
- Share of drivers with speeding infractions on record: 16.59%
17. Columbia, SC
- Share of drivers reporting a prior incident: 25.83%
- Share of drivers at-fault accidents on record: 15.03%
- Share of drivers with speeding infractions on record: 15.24%
16. Omaha, NE
- Share of drivers reporting a prior incident: 26.15%
- Share of drivers at-fault accidents on record: 14.63%
- Share of drivers with speeding infractions on record: 12.66%
15. Spokane, WA
- Share of drivers reporting a prior incident: 26.18%
- Share of drivers at-fault accidents on record: 12.41%
- Share of drivers with speeding infractions on record: 15.03%
14. North Charleston, SC
- Share of drivers reporting a prior incident: 26.22%
- Share of drivers at-fault accidents on record: 15.59%
- Share of drivers with speeding infractions on record: 14.23%
13. Chesapeake, VA
- Share of drivers reporting a prior incident: 26.27%
- Share of drivers at-fault accidents on record: 12.66%
- Share of drivers with speeding infractions on record: 15.27%
12. Virginia Beach, VA
- Share of drivers reporting a prior incident: 26.33%
- Share of drivers at-fault accidents on record: 13.30%
- Share of drivers with speeding infractions on record: 14.26%
11. Charleston, SC
- Share of drivers reporting a prior incident: 26.44%
- Share of drivers at-fault accidents on record: 15.30%
- Share of drivers with speeding infractions on record: 15.18%
10. Boise, ID
- Share of drivers reporting a prior incident: 26.57%
- Share of drivers at-fault accidents on record: 12.73%
- Share of drivers with speeding infractions on record: 14.53%
9. Toledo, OH
- Share of drivers reporting a prior incident: 26.60%
- Share of drivers at-fault accidents on record: 14.20%
- Share of drivers with speeding infractions on record: 14.76%
8. Fort Collins, CO
- Share of drivers reporting a prior incident: 26.68%
- Share of drivers at-fault accidents on record: 9.96%
- Share of drivers with speeding infractions on record: 15.10%
7. Columbus, OH
- Share of drivers reporting a prior incident: 27.71%
- Share of drivers at-fault accidents on record: 13.98%
- Share of drivers with speeding infractions on record: 16.23%
6. Beaverton, OR
- Share of drivers reporting a prior incident: 27.92%
- Share of drivers at-fault accidents on record: 13.98%
- Share of drivers with speeding infractions on record: 15.53%
5. Cincinnati, OH
- Share of drivers reporting a prior incident: 28.19%
- Share of drivers at-fault accidents on record: 14.60%
- Share of drivers with speeding infractions on record: 15.66%
4. Akron, OH
- Share of drivers reporting a prior incident: 28.59%
- Share of drivers at-fault accidents on record: 14.56%
- Share of drivers with speeding infractions on record: 15.70%
3. Des Moines, IA
- Share of drivers reporting a prior incident: 29.40%
- Share of drivers at-fault accidents on record: 12.58%
- Share of drivers with speeding infractions on record: 18.35%
2. Dayton, OH
- Share of drivers reporting a prior incident: 29.75%
- Share of drivers at-fault accidents on record: 14.22%
- Share of drivers with speeding infractions on record: 18.11%
1. Lincoln, NE
- Share of drivers reporting a prior incident: 30.79%
- Share of drivers at-fault accidents on record: 16.83%
- Share of drivers with speeding infractions on record: 16.18%
If you have any questions or comments about this article or would like to request the data, please contact insights@insurify.com.
More From 94.3 The Point