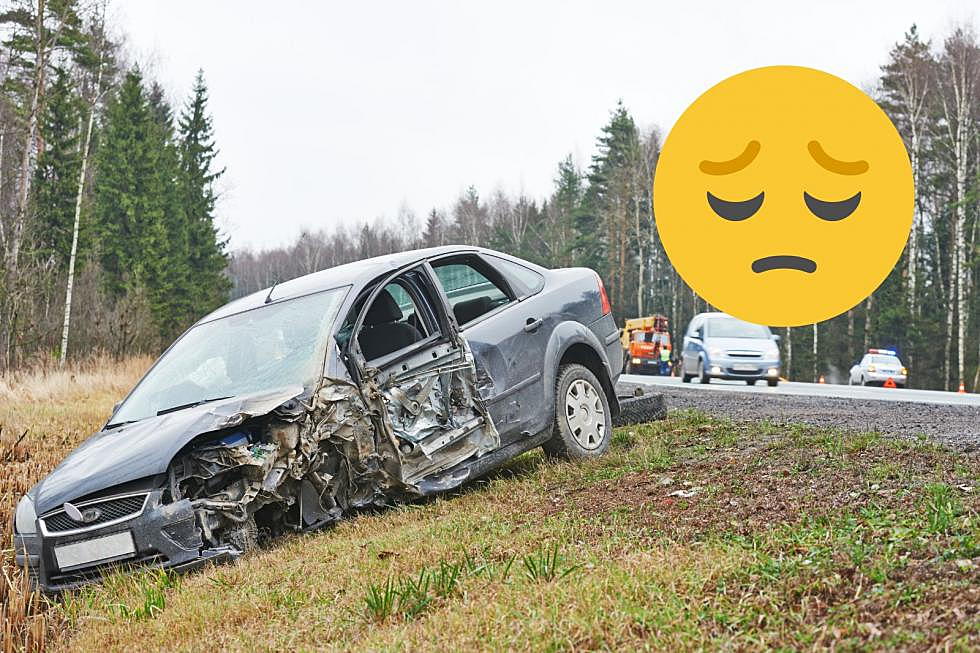
This is the most common action before a fatal crash in New Jersey
🚨 Nearly 5,000 people have been killed in car crashes in NJ since 2017
🚨 In most crashes, this is what the driver was doing moments before the wreck
🚨 Distracted driving remains one of the biggest factors in fatal accidents
Preliminary data from the New Jersey State Police show 103 fatal accidents have claimed 108 lives on state roads since the beginning of 2024.
Since 2017, nearly 5,000 people have lost their lives in fatal crashes in the Garden State.
A new analysis of data from the National Highway Traffic Safety Administration (NHTSA) reveals the most common driver behavior immediately before they were involved in a fatal collision in New Jersey.
Keep reading to find out what it was.
Distracted driving remains a big factor in crashes
In addition to the most common driver behavior leading up to a fatal crash, distracted driving remains one of the biggest contributing factors.
According to the New Jersey State Police, driver inattention has been a major contributing cause in nearly 800,000 motor vehicle crashes from 2012 to 2016 in New Jersey.
Even just reaching for your phone can increase the risk of getting into a crash by three times.
Sending or receiving a text takes a driver's eyes from the road for an average of 4.6 seconds. At 55 mph, that's the equivalent of driving the length of an entire football
field, blind.
Age is also a factor among distracted drivers
State police statistics show drivers in their 20s comprise 23% of drivers in all fatal crashes, but make up 37% of the distracted drivers who were using cell phones in fatal crashes.
The most inexperienced drivers, those under the age of 20, make up the largest proportion of distracted drivers in New Jersey. 8% of all drivers under the age of 20 involved in fatal crashes were reported as distracted at the time of the crash.
What most drivers are doing before a fatal crash in New Jersey
NHTSA reports between 2017 and 2021 there were 4,191 fatal accidents in New Jersey.
Data extrapolated by the Heninger Garrison Davis law firm found:
🚧 In the moments before a fatal crash, 64% of all the drivers involved were going straight just before the wreck.
🚧 Negotiating a curve was the second most common pre-crash movement in New Jersey, with 14% of drivers, or 589 individuals, doing so before a fatal crash.
🚧 Turning left was the third most common action being performed by 8% of drivers, which corresponds to 344 individuals, before being involved in fatal collisions.
🚧 New Jersey's fourth most common movement before a deadly crash was stopped in roadway, which was noted for 4% or 177 drivers.
🚧 Changing lanes was the fifth most common pre-event movement for 2% or 83 drivers.
While specific data involving districted driving in each of the crashes listed above is not available, safety advocates say it proves that even the most routine driving actions can be complicated by getting distracted by a cell-phone or other behavior that takes attention off the road.
Most annoying things about driving with a Jersey driver
Gallery Credit: Steve Trevelise
LOOK! Why New Jersey men claim we're never, ever lost driving
Gallery Credit: Mike Brant
LOOK: States with the highest average cost of living
Gallery Credit: Mike Brant
Report a correction 👈 | 👉 Contact our newsroom

