NJ gas prices down 5 cents a gallon in a week, below national average
Gas prices are continuing a downward trend in New Jersey and are now nearly four weeks past their recent peak following Russia's invasion of Ukraine, according to the latest update Monday from AAA Northeast.
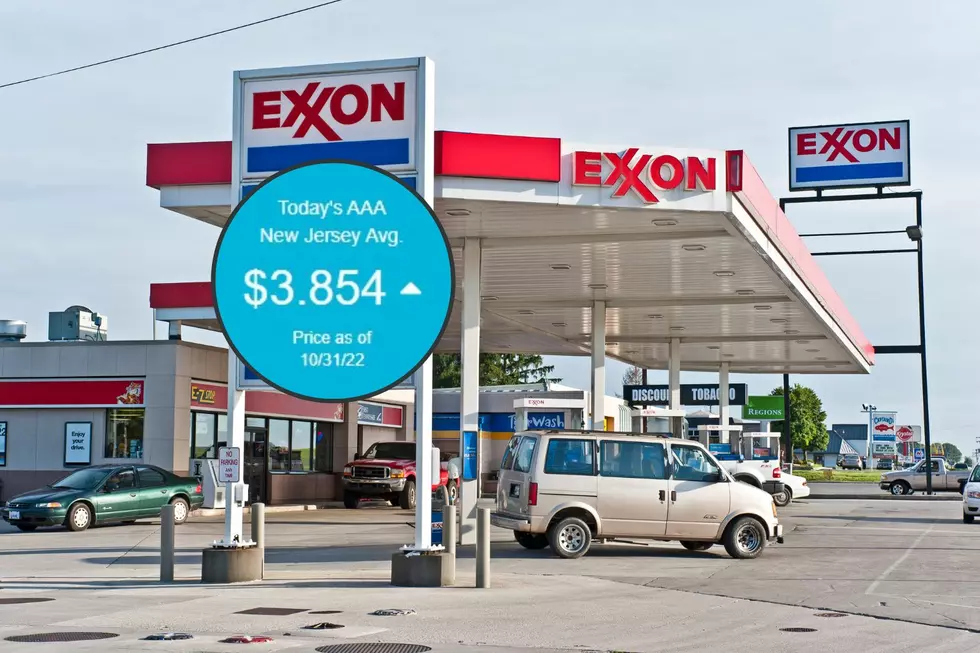
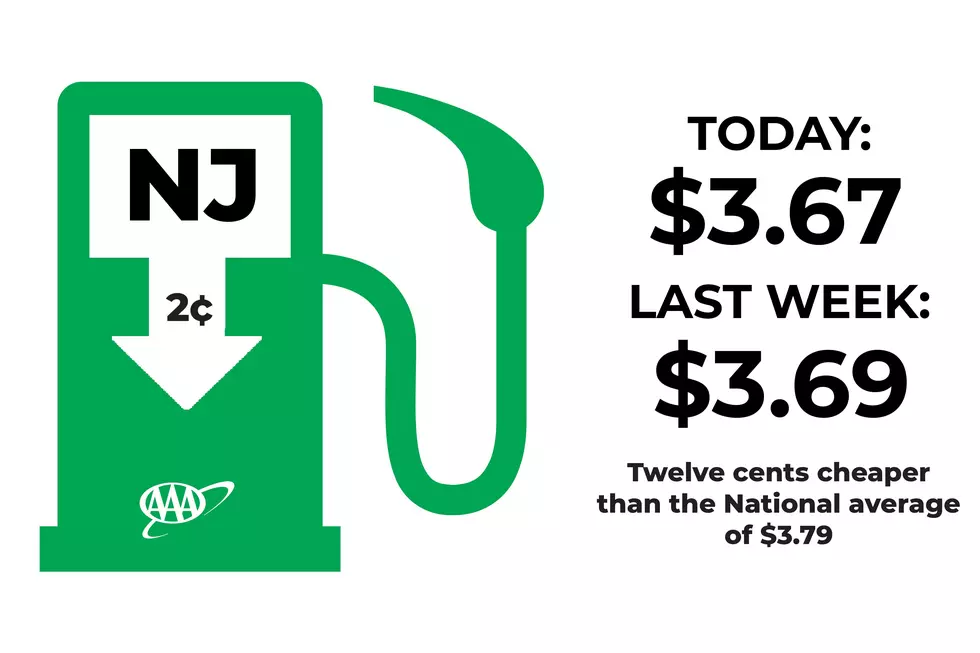
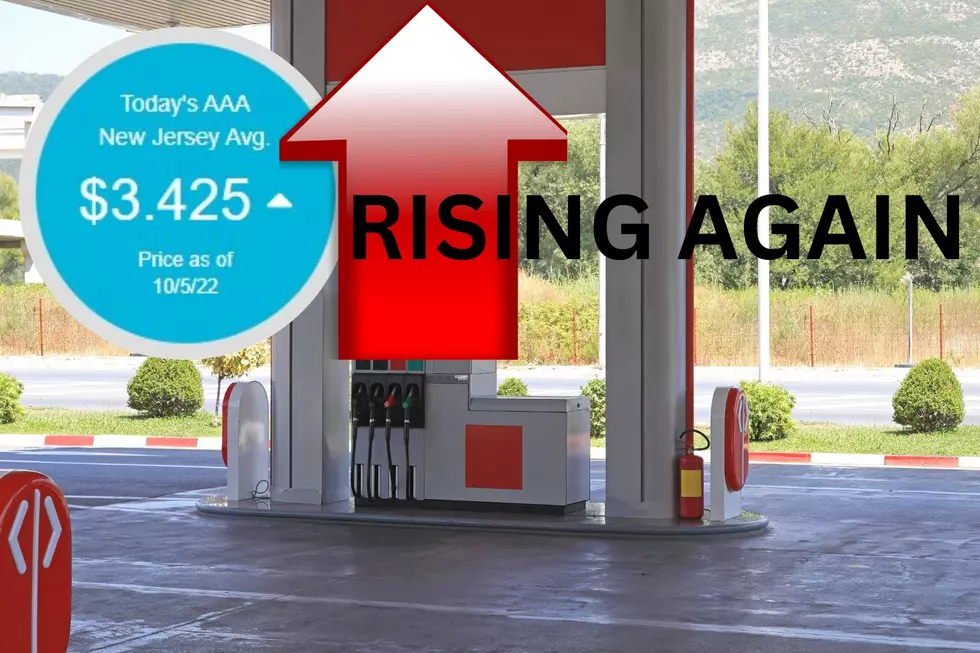
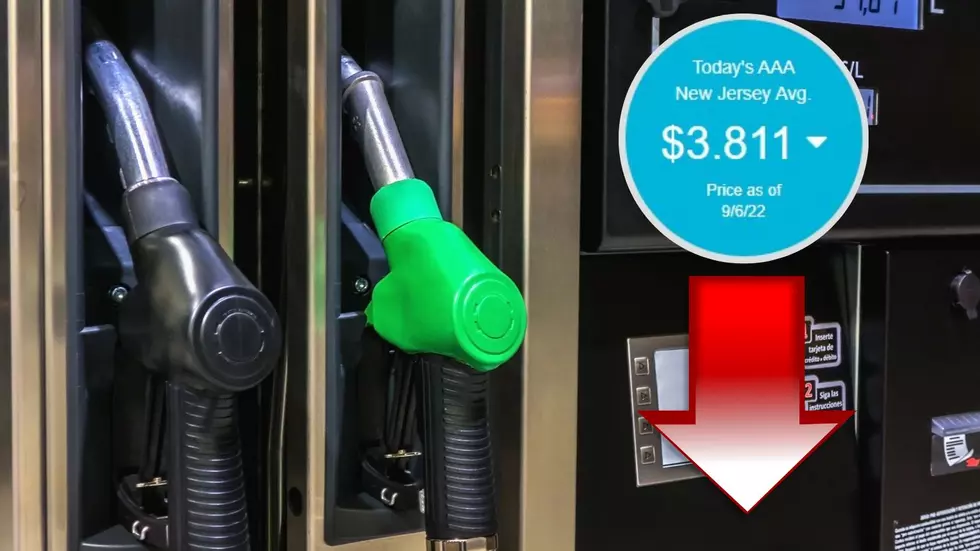
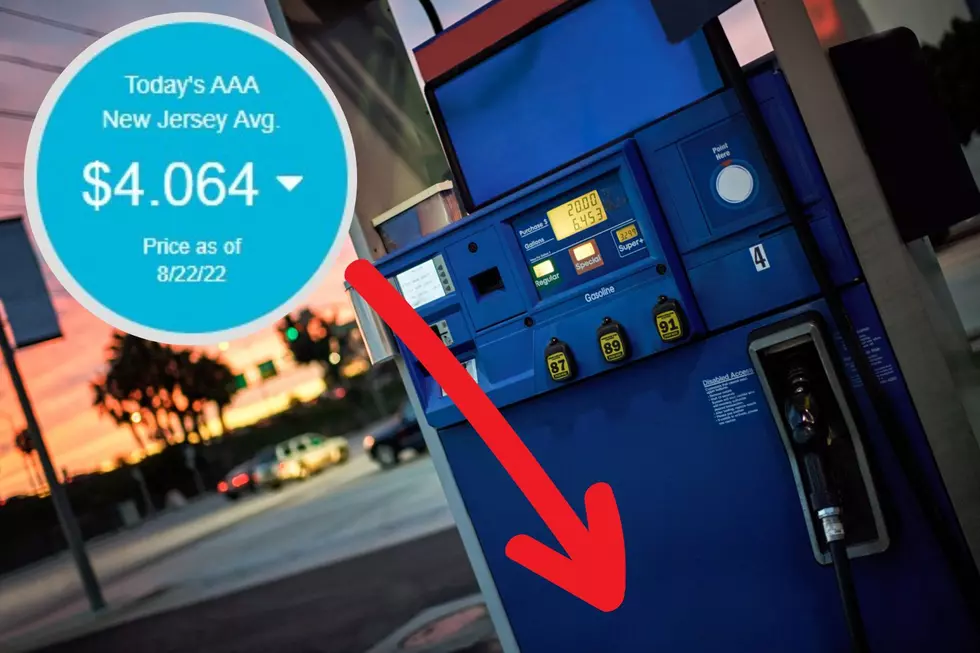
The price for a gallon of regular gasoline now stands at $4.16, down two cents from Friday and five cents from a week ago Monday. The high of nearly $4.38 was recorded by AAA on March 10.
The current national average is $4.18 per gallon, AAA said, meaning New Jersey is not only outperforming the rest of the country as a whole, but also its closest neighbors: New York state's average price was $4.29 Monday, while Pennsylvania's was $4.27.
Connecticut, which instituted a gas tax holiday, saw its average price per gallon plummet to $4.03, according to AAA. New Jersey Gov. Phil Murphy has said he would not support a similar measure for the Garden State.
AAA said the cheapest gas in New Jersey is concentrated in the Vineland area, where the average price is $4.08 for a gallon of regular. The most expensive fuel in the state is in the Newark region, at almost $4.22.
Diesel prices remain high, just a tick under $5.28 on average statewide, about a cent and a half lower than a recent peak reached last Wednesday.
Regular gasoline had already begun a steep upward climb one month ago, when drivers in the Garden State were paying $3.89 per gallon. A year ago at this time, the statewide average price was almost $2.92, according to AAA figures.
Patrick Lavery is a reporter and anchor for New Jersey 101.5. You can reach him at patrick.lavery@townsquaremedia.com
Click here to contact an editor about feedback or a correction for this story.
How the world saw New Jersey — 1940s to 1980s
Gallery Credit: Nicholas Damelio
New Jersey Diners that are open 24/7
Gallery Credit: Mike Brant, Jeff Deminski
2021 NJ property taxes: See how your town compares
Gallery Credit: Michael Symons/Sergio Bichao
More From 94.3 The Point