If This Study Is Right Then New Jersey Doesn’t Really Love Coffee
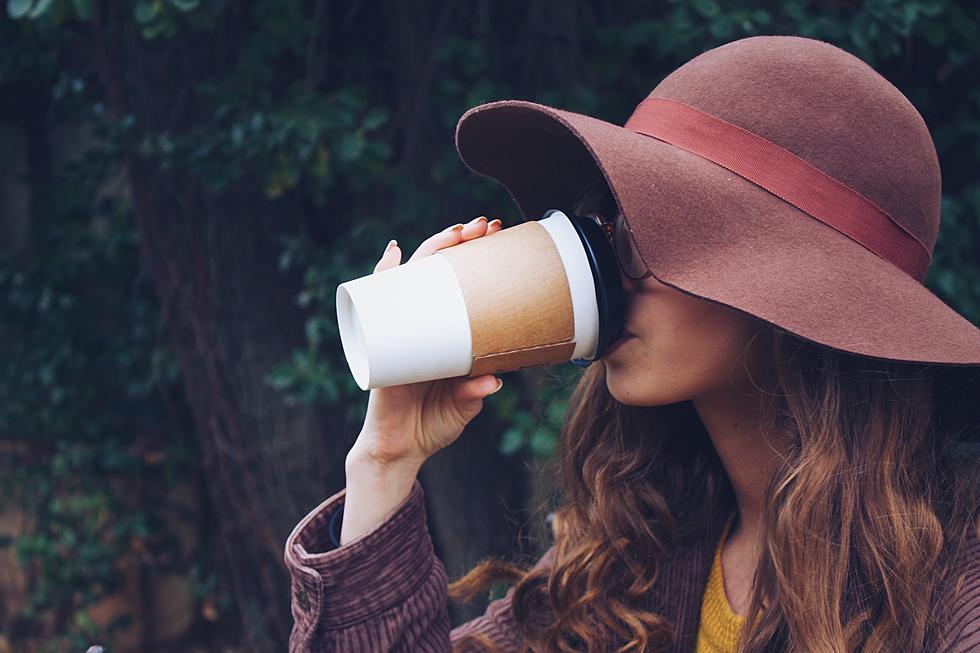
If you think that you know what it is to be a true resident of New Jersey, a recent study may prove you wrong. If you imagine the typical New Jersey adult, that person almost certainly is holding on to a cup of coffee. And not just holding it. Gripping it for dear life is more like it. But that picture may be flawed.
Listen to Lou Russo mornings on 94.3 The Point and download our free 94.3 The Point app.
According to Zippia, New Jersey is not among the most caffeinated states in the nation. As a matter of fact, it's actually among the least caffeinated. What? Wait a minute. Then why was I on line at the Starbuck's drive-thru for 20 minutes this morning?
To be exact, the study says we are the 4th lowest caffeinated states in America. How could they possibly come to this conclusion? It turns out they used factors like how many cups of coffee drink each day, how many residents drink soda or juices containing a lot of sugar, and how often residents Google things like "coffee near me".
First of all, a true New Jersey resident would never have to Google the nearest coffee location. We have them all committed to memory. And we also know their hours of operation by heart.
And by the way, New Mexico drinks the most coffee with an average of 2.4 cups per day. Now, I'm no expert, but is it even possible that we don't drink at least that much a day here in the Garden State? Apparently not.
We also learned some other coffee tidbits for the Garden State. Our most popular way to drink coffee is sugar and cream. And our most searched coffee type is iced latte.
And by the way, this study was released in the past six months, so it's fresh info. It's just so hard to believe.
If It's Not Coffee Then What's the Signature Drinks In New Jersey?
KEEP READING: 15 Natural Ways to Improve Your Sleep
The States Where People Live The Longest
Gallery Credit: Hannah Lang
More From 94.3 The Point